NITI Aayog releases first ever India Innovation Index (III) – Key Highlights and Our observations
The most interesting and highly appreciable thing is initiation of preparation of India Innovation Index (III) and efforts to identify relevant matrices. While any beginning always has a scope for improvement subsequently, this endeavor clearly represents active involvement of present government and agencies involved.
KEY HIGHLIGHTS
Why India Innovation Index (III)?
The India Innovation Index (III) aims to perform two objectives. The first one is to help better understand a state’s innovation ranking and relative performance by incorporating key indicators relating to the seven pillars that can be used to understand the performance of a state with regards to its innovation capabilities. Secondly, it aims to empower states to improve their innovation policies while leveraging their strengths and overcoming their challenges. To help policy makers, design policies aimed at driving innovation across regions.
A country’s competitiveness is defined as the productivity with which it uses its resources like land (natural resources), labour (human beings) and capital. When firms innovate, they derive prosperity by creating value adding products through realization of the resources. This ability to innovate increases the productivity and in turn enhances the competitiveness. So innovation should be considered as the basis of creating prosperity.
Why Now?
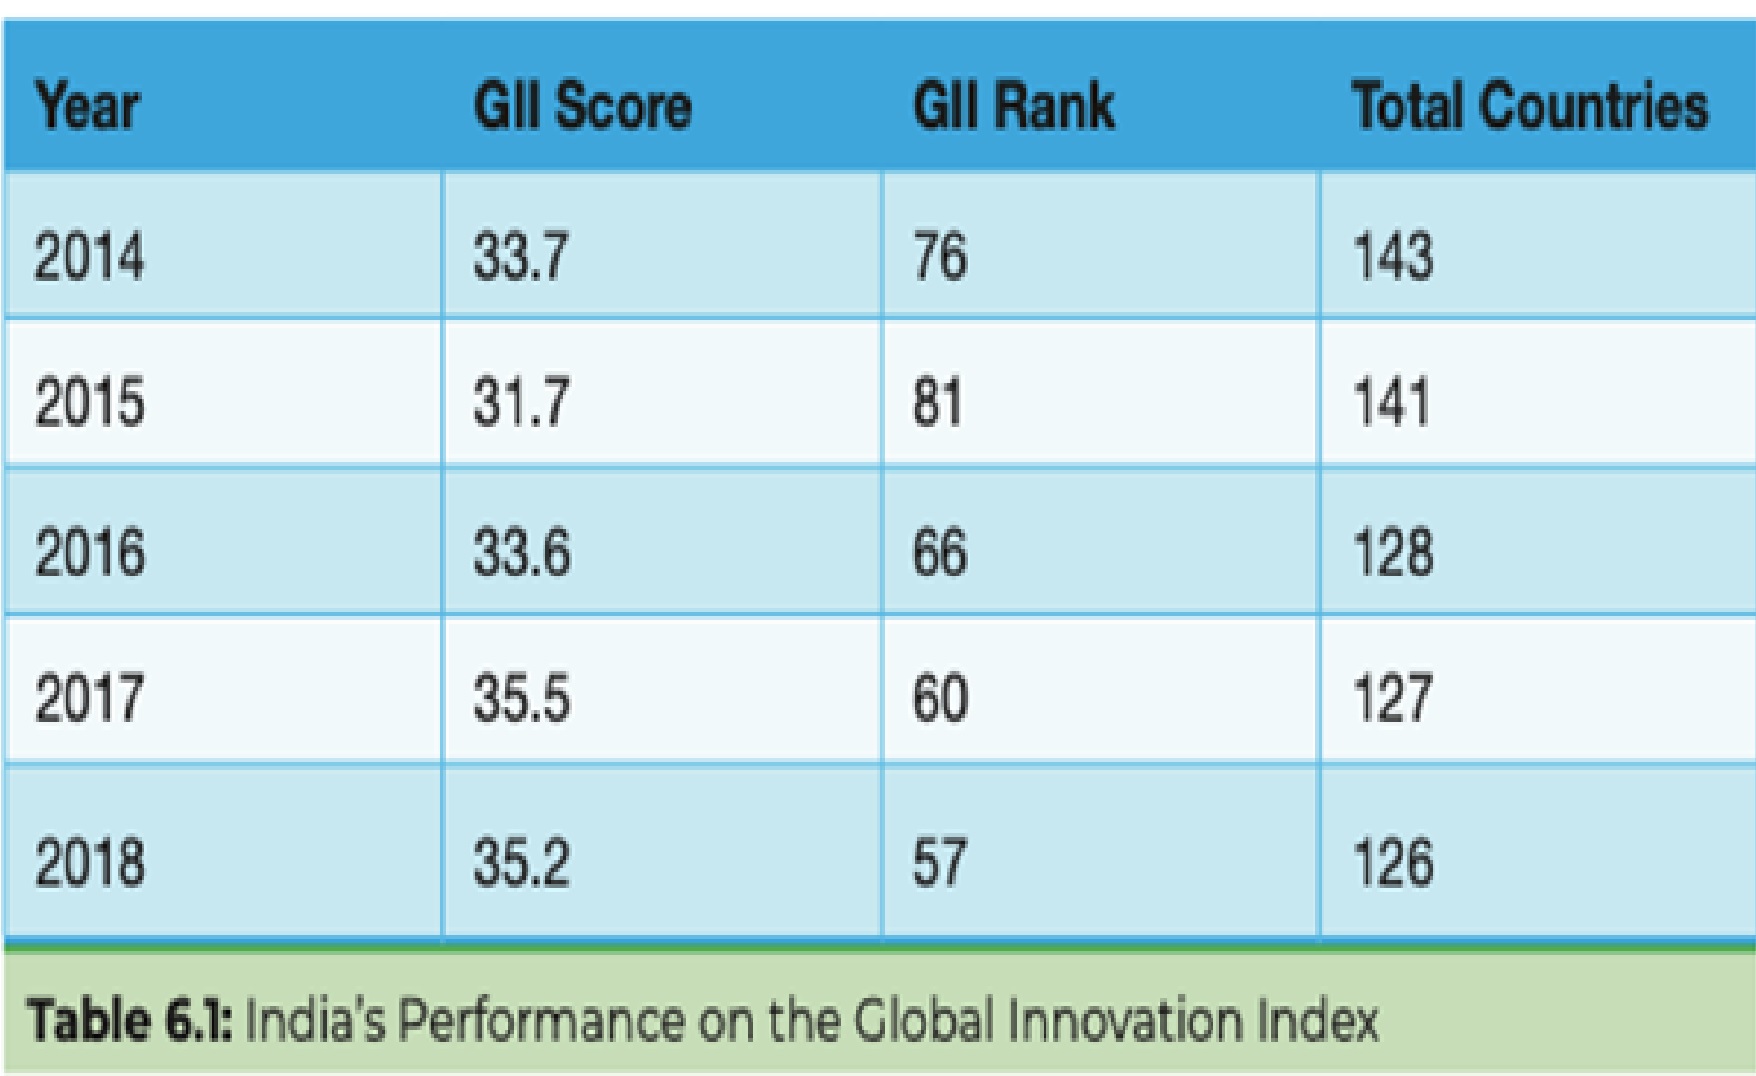
The India Innovation Index (III) 2019 comes at a time when innovation has become a subject of significant concern for policymakers in the country. With India among the fastest growing economies in the world, the next big challenge is to sustain that level of growth for a longer period of time. Ensuring future economic growth will require solutions that are more creative than any we have seen so far. In that the role that innovation plays in accelerating economic growth and enhancing competitiveness is evident.
Page 23
The development of countries can be categorized into three stages:
- Factor driven – where growth is dependent on exploitation of natural resources.
- Investment driven – where production is more efficient and capital intensive.
- Innovation driven – that focuses on enhancing the productivity of the factors of production.
With a vision of factor driven economy to innovation driven economy – India Innovation Index (III) is the step further that draws roadmap as to where economy is and what challenges lies ahead.
What is India Innovation Index (III)?
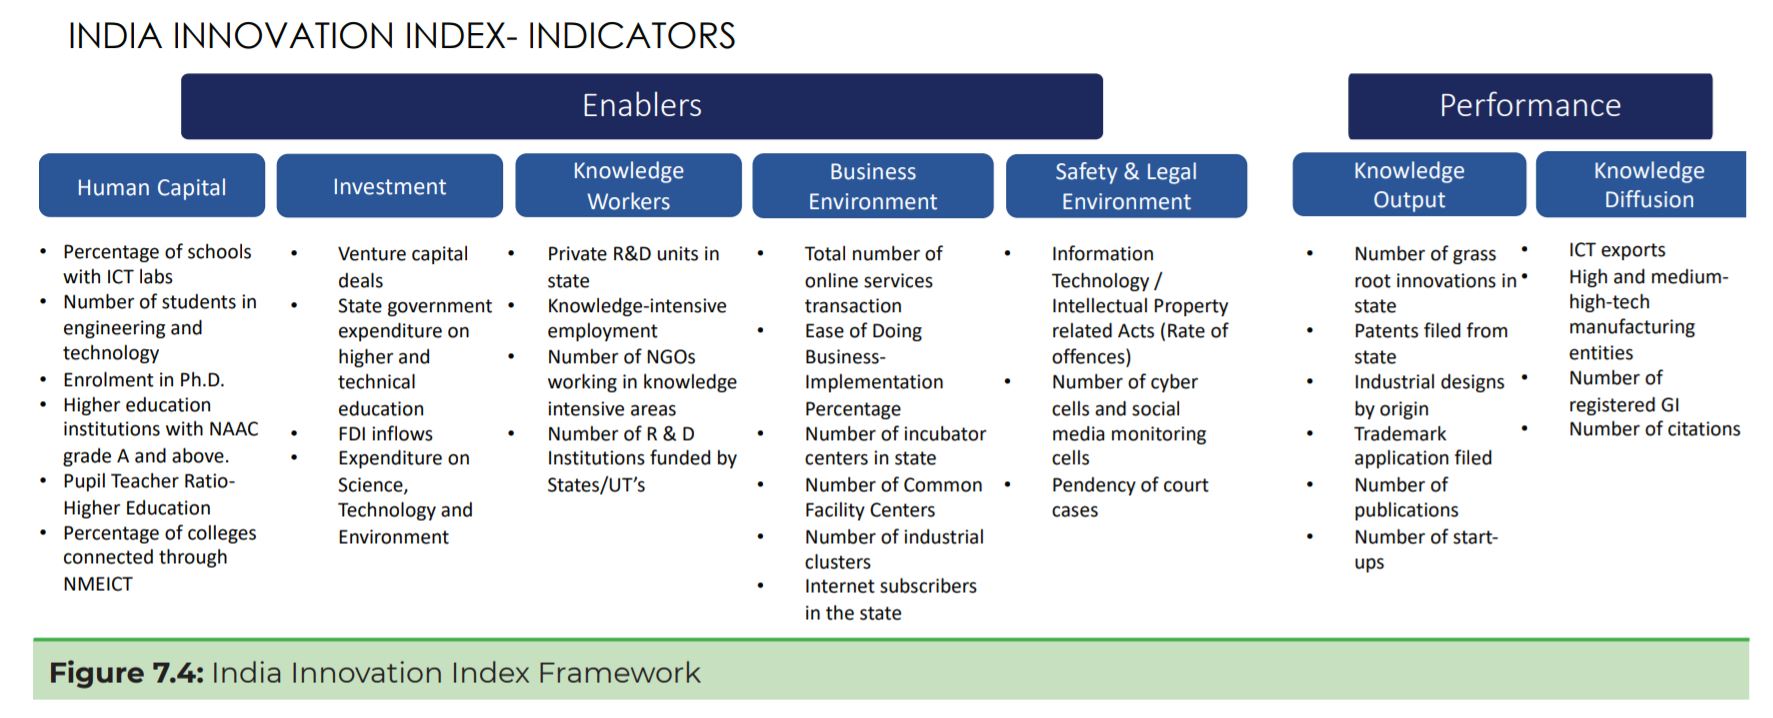
India Innovation Index (III) measures innovation inputs through ‘enablers’ and innovation output as ‘performance’. Five enabler pillars capture elements of the state economy that act as inputs to innovation environment: Human Capital, Investment, Knowledge Employment, Business Environment, and Safety & Legal Environment. Two performance pillars – Knowledge Output and Knowledge Diffusion – capture its performance.
 Page 28
Key findings
Opportunities for entrepreneurs – Invest and capitalize from huge human capital.
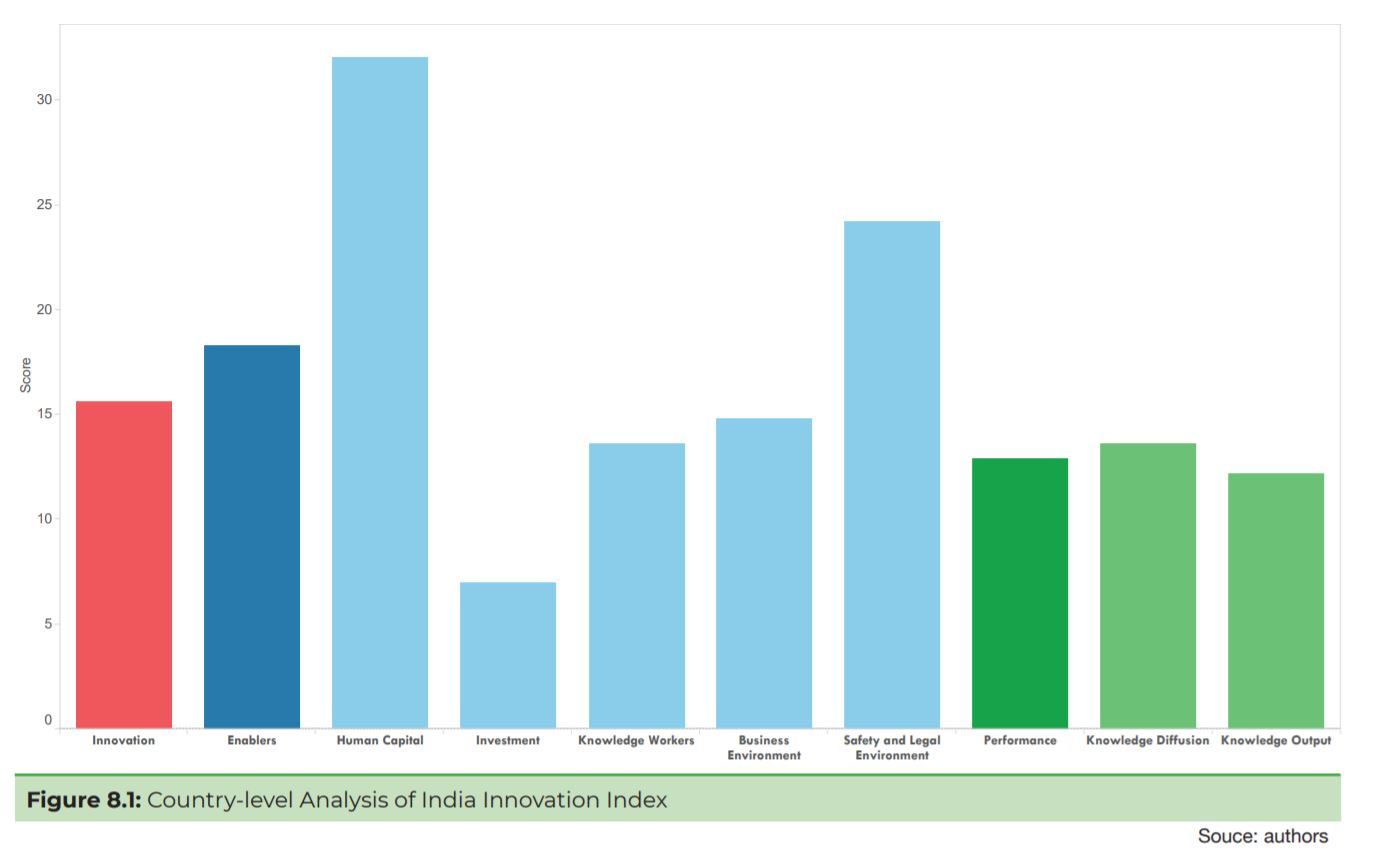
India Innovation Index (III) – Country Level Performance (Page 32)
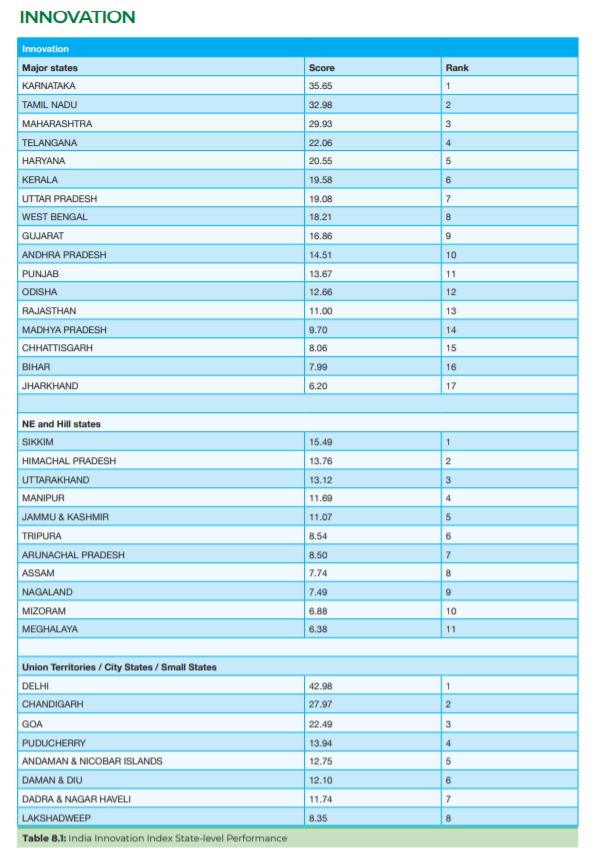
India Innovation Index (III) – State Level Performance (Page 34)
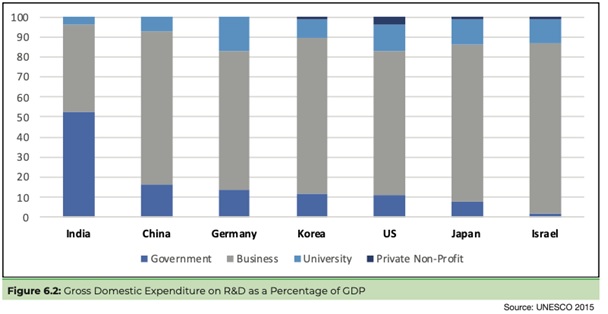
Global private spending in Innovation.
The private spending in India towards innovation is seriously lacking. Compare to 77 percent in China, the share of private sector expenditure towards R&D in India is merely 43.5 percent.
page 24
Way Forward
- Improve quality of Human Capital.
- Encourage regional competitiveness.
- Industry-Academia linkage.
- Reconsider IP regime.
- Improve regulatory framework.
- Improve private spending in innovation.
Source
https://niti.gov.in/sites/default/files/2019-10/India_Innovation_Index_Report_2019.pdf
Our Observations
We considered knowledge output (>10) as key performance indicator to identify key factors driving innovation in these states. To identify impact of individual enabling factor, ratio of individual enabler to average enabler value was identified. Further, percentage proportion of above average states in outperforming group and underperforming group was calculated for each of the five enabling factors.
|
Knowledge output (no of states) |
Human Capital | Investment | Knowledge worker | Business Environment | Safety and legal environment |
| >10 :
15 States (%) |
33.33 | 53.33 | 73.33 | 60.00 | 46.67 |
| <10 :
21 States (%) |
61.90 | 33.33 | 28.57 | 47.62 | 52.38 |
| Ratio of percentage | 0.54 | 1.60 | 2.57 | 1.26 |
0.89 |
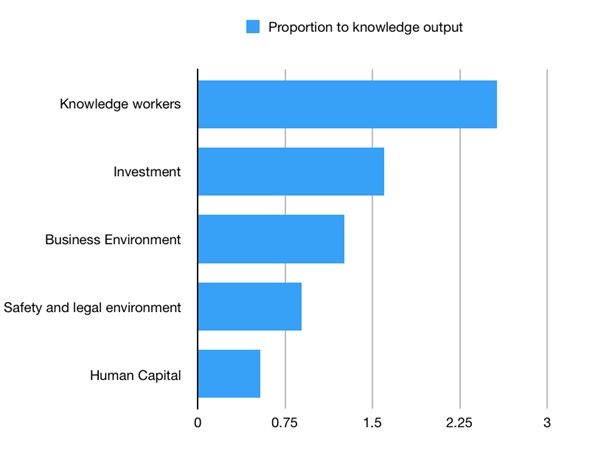
Among five key enablers, knowledge worker is currently the key factor driving higher knowledge output of the out-performing states which is followed by investment and business environment.
Proportionately higher no of underperforming states is having below average knowledge workers. Whereas higher no of outperforming states is having above average knowledge workers.
Proportionately high no of states with human capital and safety & legal environment above national average underperformed and are having low knowledge output. This indicates that human capital and safety & legal environment are available and are not critical factors.
This derivative analysis also indicates that safety & legal environment and business environment are less critical compare to knowledge workers and investment. This outcome correlates with the observation in the report that private spending in innovation is less in India compare to global economy. These finding reflects that policy makers have relatively lesser role to play in driving innovation.
Lastly, Many congratulations and thanks to NITI Aayog, government and other agencies for this initiative.
Regards,
Kushal Vyas,
Registered Patent Agent.
Managing Partner.
All views presented herein are general in nature.